

The SAT and g: A Correction
A short Revision of my g loading estimates

This morning, I noticed that my estimate of the g loading of the SAT from the NLSY79 was erroneous. In this post, I explain how I correctly estimated the g loading of the SAT from the NLSY97 data, as well as how I messed up when estimating it from the earlier NLSY. I then correct my estimate.
First, I will explain how I got my correct estimate from the NLSY97. Coyle and Pillow’s 2008 study provided the following graph based on ASVAB and SAT figures from the NLSY (the ASVAB is an achievement test that is known to be highly correlated with IQ):

Numbers five through sixteen represent different subtests of the ASVAB. Number 1 represents the SAT. Therefore, looking at those last twelve cells of the first row, corresponding to the 5th to 16th columns, gives the correlation of each subtest to the SAT. Next, I used the following figure:

From the A side of this figure, the correlation between all of these subtests and g can be found, using the arrows going from g into each of the subtests. Everything on the right side of A is a subtest of the ASVAB except for the SAT. g is, of course, calculated by Coyle and Pillow based on the test which these subtests make up. I then created a Google Spreadsheet with every subtest’s correlation with the SAT and g. I used that data to calculate both the Spearman rank order correlation (rho) and the Pearson product-moment correlation (r) manually, using a basic, handheld calculator (because I do not know how to code). My results looked as follows:
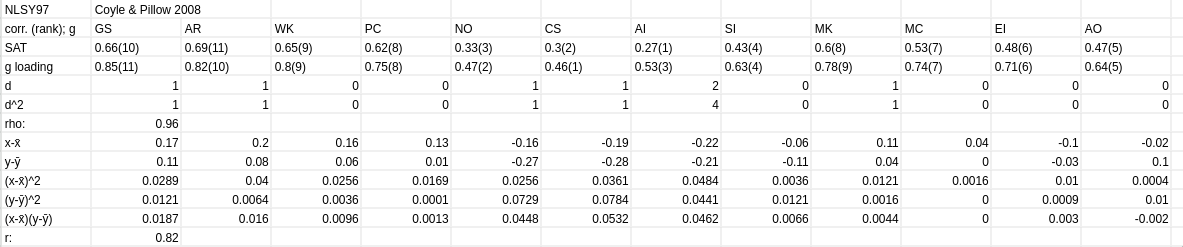
The rho turned out to be .96, and r was .82. Both of these correlations are very high. From my understanding, the r estimate should be preferred here, because small numbers of units of analysis (in this case twelve) seem to—in my experience—cause very high or low rank order correlations, probably because the distances between the subtests are treated ordinally. Either way, a g loading of .96, or even .82, is high, and means that a very good predictor of how well a given subtest correlates with the SAT is how well it measures general intelligence. This strongly supports the conclusion that the SAT’s correlation to the ASVAB is mostly caused by the fact that it measures intelligence.
Now, for the NLSY79. Frey and Detterman’s 2004 study did provide data on each subtest’s correlation with their overall measure of g. But the authors did not specify the subtests’ correlations with the SAT, making the same analysis impossible. Fortunately, the authors did provide estimates of the ASVAB’s correlation with various other intelligence tests, as well as those tests’ correlation with the SAT. Their results were presented in the following table:

Arthur Jensen, in his 1998 book The g Factor: The Science of Mental Ability, wrote that there are two ways to estimate the g loading of an IQ test. Here is what he said (pp.90-91):
Here it is important to distinguish between two things: 1) the total variance attributable to g when we factor analyze the set of various subtests that compose the IQ test, and 2) the g loading of the IQ itself (derived from the total of the standardized scores on all of the subtests) when the IQ is factor-analyzed among a large correlction of diverse cogntive tests.
Probably the most typical example is the Wechsler Intelligence Scale for Children (WISC) and for Adults (WAIS). the Wechsler battery consists of twelve subtests (Vocabulary, Similarities, Information, Comprehension, Arithmetic, Digit Span, Digit Symbol, Picture Completion, Block Design, Picture Arrangement, Object Assembly and Mazes). When this battery is factor analyzed in various age groups of the standardized population, the percentage of the total variance in all the subtests accounted for by g averages about 30 percent in a hierarchical analysis and about 37 percent when g is represented by the first principal factor. The average percentage of variance accounted for by each of the three group factors in a hierarchical analysis is: Verbal 6 percent, Performance (largely spatial ability) 6 percent, and Memory 4 percent. Some 40 percent of the total variance is specific to each subtest, and about 10 percent is measurement error (unreliability). the g factor scores obtained from the whole Wechsler battery are correlated more than .95 with the tests’ total score (called Full Scale IQ). With such a high correlation between the factor scores and the IQ scores, it is pointless to calculate factor scores.
Factor analyses of the composite scores (or IQs) of a number of standard IQ tests are exceedingly rare, because the total IQ is an amalgam of various factors that does not lend itself to factor analysis with much exception of finding more than one significant factor, namely, g…[O]ne can make a good estimate of the g loadings of IQ tests from the correlations between various IQ tests reported in the literature, even when no more than two or three tests were administered to the same sample. I have summarized such correlations elsewhere [citation omitted]. The correlations between various IQ tests average about +.77. The square root of this correlation…is an estimate of the average g loading of IQ tests, since the correlation between two tests is the product of their factor loadings. This value (.88) is an overestimate of the average g loading if it is assumed that various parts of tests also have certain group factors in common (for example, two purely verbal tests). If we look at just those tests that appear to have no group factor in common (e.g., the Raven and the Peabody Picture Vocabulary), the average correlation between them is +.69, which estimates an average g loading of [.83].
Although the first method (correlating the full scale IQ to g) is, in this case, not possible, the second method is. If we simply get the the average correlation between the SAT and the other tests, it is possible to get its g loading that way. It is not possible to do this with the ASVAB and the SAT’s correlation, because that correlation is only given for the ASVAB’s g score, and not its full scale score. Suffice it to say that, if this correlation were usable with Jensen’s method (I assume that it will regularly overestimate the g loading if one of the scores is a g score), its root, .91, would not be too far off of the NLSY97 estimates (and if it were estimated the same way in that sample, the g loading would be .88).
Weighted for sample size, the average correlation between the SAT and one of the other IQ tests, weighted for sample size, based on Frey and Detterman’s table, is .76. The square root of this figure is .87. This is very close to what Jensen found as the average for IQ tests generally. Because some of those tests that the SAT was compared to were scholastic achievement tests just like itself (SAT=Scholastic Aptitude Test), this g loading should, perhaps, be reduced to something like .85. Either way, this estimate is very similar to the pearson correlation that I found from the NLSY97, and is very high.
I did not know that this was how you were supposed to do it when I wrote my original post, however. Despite citing this exact passage from Jensen’s book in that section of my post, I did not follow what it said. Probably, I had misread it, and did not notice that it could be applied to the situation; instead, I cited it to show that correlation between tests is an indicator of g loading, apparently forgetting that Jensen provided the method by which you could calculate g loading from such data. My method was much less promising than this one. I used the same table to collect information on each test’ correlation to g extracted from the ASVAB, and also its correlation to the SAT. I then found the correlation between these two. My results looked like this:
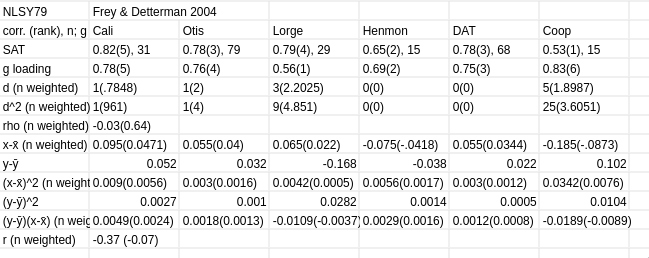
For some reason, my rho weighted for sample size was .64, while my weighted r was -.07. I may have made some error when calculating r, which I am less used to calculating than rho. Either way, this result is very equivocal, on top of my method not making sense in light of a much better method existing. Therefore, I decided to throw out this analysis entirely for the purpose of this post, and will use my new estimate.
In conclusion, the NLSY79 and ‘97 both provide evidence of high g loadings of the SAT, from about 0.8 to 0.9. My new estimate from the former sample adds some weight to my conclusion that the SAT is mostly an IQ test.